[ui!] ENVIRONMENT

Municipal sensor systems and data as the key to municipal sustainability

Brief information

  • Added value for citizens
  • Implementing digitalisation
  • Recognising environmentally relevant developments
  • Improved environmental management
  • Be prepared for future tasks

Data-based solutions as the key to municipal sustainability: [ui!] ENVIRONMENT

Municipalities face numerous challenges in order to maintain a healthy and clean environment and to develop and implement suitable measures. The ultimate goal is to maintain and further improve the high standard of living in the municipalities. Are you wondering how digitalisation could help you achieve your (statutory) sustainability goals?

Imagine your municipality uses sensors that immediately sound the alarm when water levels rise and thus warn affected citizens of flooding in good time.

Similarly, a noise monitoring system monitors noise pollution at road junctions and train lines and provides information about increased levels so that a factual basis for noise protection measures can be created.

Functionalities

  • recognise environmentally relevant developments at an early stage and act quickly.

  • organise your municipal environmental management more efficiently and transparently in order to comply with legal limits.

  • improve the quality of life of your citizens.

Who is [ui!] CLIMATE aimed at?

Would you like to focus on your professional work?

You receive the solution as software-as-a-service, which allows you to concentrate fully on your digitalisation projects. Your data is protected in a separate client of our open urban data platform [ui!] UrbanPulse and securely collected, stored, processed and visualised by us in the form of a professional service. We understand the limited human resources of small and medium-sized municipalities and have therefore developed [ui!] ENVIRONMENT so that you can concentrate fully on your specialised tasks.

Would you like to make data-based decisions?

The digitalisation of the public sector generates municipal data as part of digital applications and municipal infrastructures using digital measurement and control devices. This data is often stored in silos of municipal infrastructures and is used in a specialised and isolated manner. The portfolio of functional modules from [ui!] ENVIRONMENT is based on the open urban data platform [ui!] UrbanPulse Data can thus be combined from different data sources and visualised in a targeted manner to provide you with the tools for a comprehensive picture of a municipality's key environmental concerns.

Are you looking for digital added value for professionals AND citizens?

The products from [ui!] ENVIRONMENT integrate seamlessly into the market-proven open urban data platform [ui!] UrbanPulse, as well as into the successful smart city visualisation tool for citizens, the [ui!] COCKPIT. The functional modules are also available as web-based specialist applications, which visualise the data for specialist users in our [ui!] DATALAB.

[ui!] ENVIRONMENT im Überblick

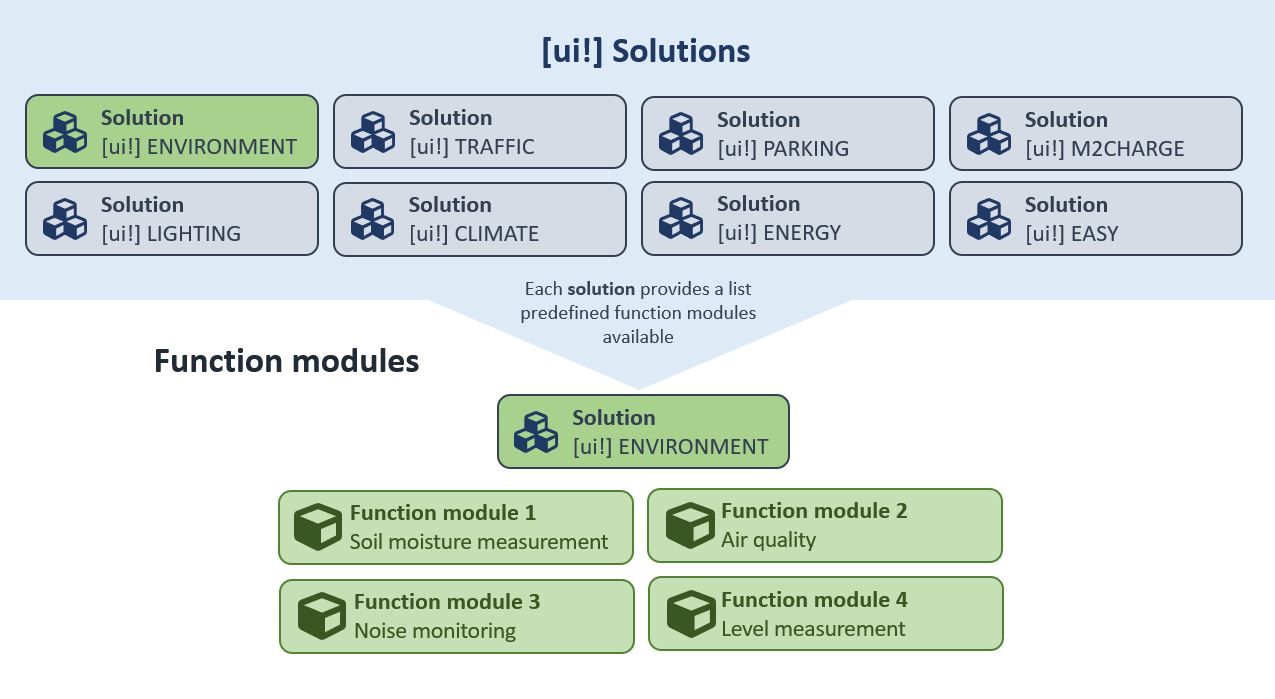
The [ui!] ENVIRONMENT solution is made up of the four function modules:

  • soil moisture monitoring, 
  • air quality monitoring, 
  • water level monitoring, 
  • noise monitoring

Each of these modules deals with a separate sub-topic.

Standards and cooperation

The digitalisation of the public sector generates municipal data as part of digital applications and municipal infrastructures using digital measurement and control devices. This data is often stored in silos of municipal infrastructures and is used in a specialised and isolated manner.

By using an open urban data platform in accordance with DIN SPEC 91357, this data can be securely brought together in a central location.

The [ui!] ENVIRONMENT portfolio of function modules is based on the [ui!] UrbanPulse open urban data platform. Data can be combined from different data sources and visualised in a targeted manner in order to create the tools for a comprehensive picture of a municipality's key environmental concerns.

As a central component of municipal urban development, [ui!] ENVIRONMENT with its environmental data is an excellent link to the [ui!] TRAFFIC and [ui!] PARKING solutions.

In combination, these solutions provide you with a comprehensive picture of your municipality's key environmental concerns and are suitable building blocks for implementing your environmental strategy on the basis of solid data.

Visualisation and decision support

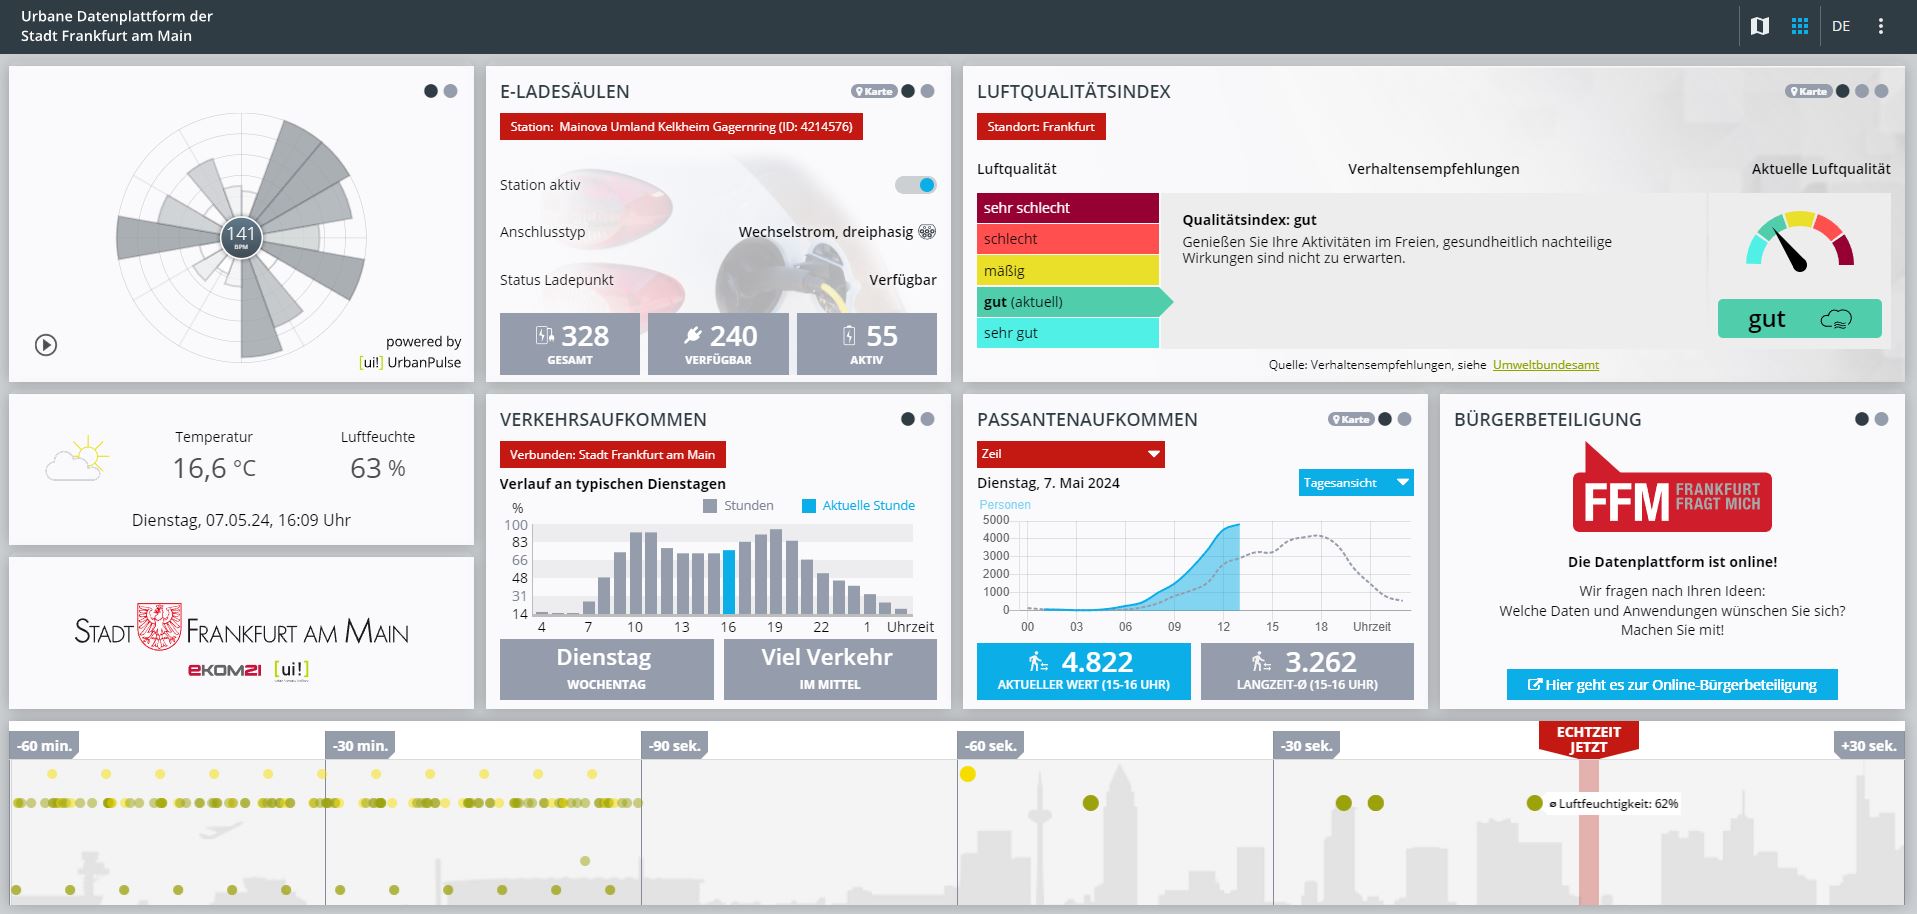
At [ui!], we believe that municipal digitalisation must be considered and communicated holistically. That's why our solutions ensure that the evaluation results can be visualised both internally and externally.

  • The [ui!] COCKPIT is the option to visualise processed data for citizens. With the help of a public smart city cockpit, you can provide the public with aggregated information about the local environment.

    COCKPIT Frankfurt

  • The [ui!] DATALAB is the tool for advanced environmental data analyses that provides specialist users with a municipal situation picture (e.g. climate managers, digitalisation department, and many others). It integrates seamlessly into [ui!] UrbanPulse and thus promotes cross-departmental collaboration.

    COCKPIT Frankfurt

Connection and connectors

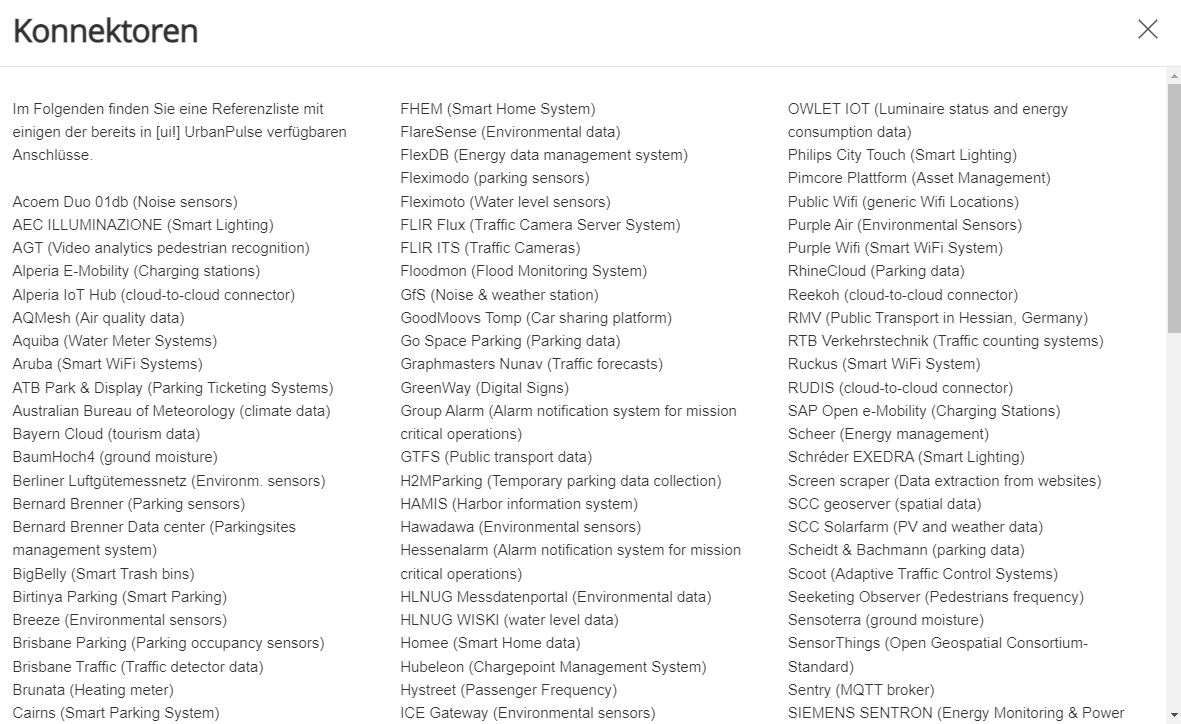
If external data from existing systems or in-house sensor technology is to be integrated, it must be connected to the Open Urban Data Platform via a so-called connector.

Konnektorenliste

All use cases that we have tested and preconfigured can be selected from our standard set of use cases for specific topics. The prerequisite is that your data sources can be connected with existing connectors from our [ui!] connector library.

The visualisation, which is based on the standard tile catalogue without any changes, is pre-configured by you using the configurator and then created for you by us.

If no connector is available for your desired system, we can develop a connector for you. Please discuss this option with us directly.

Konnektoren

Im Folgenden finden Sie eine Referenzliste mit einigen der bereits in [ui!] UrbanPulse verfügbaren Anschlüsse. 

Acoem Duo 01db (Noise sensors)
AEC ILLUMINAZIONE (Smart Lighting)
AGT (Video analytics pedestrian recognition)
Alperia E-Mobility (Charging stations)
Alperia IoT Hub (cloud-to-cloud connector)
AQMesh (Air quality data)
Aquiba (Water Meter Systems)
Aruba (Smart WiFi Systems)
ATB Park & Display (Parking Ticketing Systems)
Australian Bureau of Meteorology (climate data)
Bayern Cloud (tourism data)
BaumHoch4 (ground moisture)
Berliner Luftgütemessnetz (Environm. sensors)
Bernard Brenner (Parking sensors)
Bernard Brenner Data center (Parkingsites management system)
BigBelly (Smart Trash bins)
Birtinya Parking (Smart Parking)
Breeze (Environmental sensors)
Brisbane Parking (Parking occupancy sensors)
Brisbane Traffic (Traffic detector data)
Brunata (Heating meter)
Cairns (Smart Parking System)
Cambio (Car sharing platform)
Casambi (Smart Lighting)
Chargecloud (Charging stations)
ChargeIt (Charging data)
ChargePointOperator (OCPI Charging data)
Cisco Meraki (Smart WiFi Systems)
Civento (Construction Sites)
Clean City Networks (Waste bin data)
Cleverciti OffStreet (Parking Management)
Cleverciti OnStreet (Parking Management)
Cleverciti Ticks (Parking Management)
Cologne Parking (Parking garages data)
Cologne Traffic (Traffic flow data, Traffic Obstructions)
Comark Laser Scanner (Bike detection sensors)
Connctd IoT (Smart Home System)
Continental Carsharing (Car sharing platform)
Corona Incidence Report (COVID-19 Situation)
Count and Care (MQTT connector)
Crossfleet (Car sharing platform)
CSV Data (generic data import)
Datex II (traffic data)
DB ParkSpace (Parking Data)
DB Flinkster (Car Sharing)
DB Call a Bike (Bike Sharing
DEFAS (Public Transport data)
DFKI onboard Unit (Car Telemetry Interface)
Discovergy (Smart Meter data)
Duo Smart Noise (Noise sensors)
Eco-counter (Traffic count data)
e-sensio urban SmartBox (Environmental Sensors)
EarthSense (Air Quality)
EDIFACT MSCONS (Energy Data)
Eluminocity (Charging data)
Emio (Environmental sensors)
EnBW Sm!ght (Smart lamp post, Environmental Sensing & EV Charger)
Enevo (Waste bin data)
e-netz InfoMap (Construction Sites)
Entega (Energy Distribution Grid)
Feratel (Event Calendar)
FHEM (Smart Home System)
FlareSense (Environmental data)
FlexDB (Energy data management system)
Fleximodo (parking sensors)
Fleximoto (Water level sensors)
FLIR Flux (Traffic Camera Server System)
FLIR ITS (Traffic Cameras)
Floodmon (Flood Monitoring System)
GfS (Noise & weather station)
GoodMoovs Tomp (Car sharing platform)
Go Space Parking (Parking data)
Graphmasters Nunav (Traffic forecasts)
GreenWay (Digital Signs)
Group Alarm (Alarm notification system for mission critical operations)
GTFS (Public transport data)
H2MParking (Temporary parking data collection)
HAMIS (Harbor information system)
Hawadawa (Environmental sensors)
Hessenalarm (Alarm notification system for mission critical operations)
HLNUG Messdatenportal (Environmental data)
HLNUG WISKI (water level data)
Homee (Smart Home data)
Hubeleon (Chargepoint Management System)
Hystreet (Passenger Frequency)
ICE Gateway (Environmental sensors)
INCOTEC (Passenger Frequency)
INRIX (Parking data)
Intelliport IPS-403 NB-IoT (Traffic Sensor)
JSON Schema (generic data import)
KairosDB (Timeseries Database Connector)
Kerlink LoRa IoT Station (LoRaWAN Gateway)
Kimley Horn KITS (Traffic data)
Klimaherzen (CO2-Savings Incentive system)
KNX (Building Management System)
KVB (Public transport station data)
LanUV (NRW environment data)
Las Vegas Traffic (Traffic detector & signal state data)
Libelium Plug&Sense Smart City (Sensor devices)
Libelium Plug&Sense Smart Environment (Sensor devices)
Libelium Plug&Sense Smart Environment Pro (Sensor devices)
LuenNi (Niedersachsen environment data)
manageE (per second energy meter)
Marine traffic (Ship monitoring system)
MDM (moblity data marketplace)
Mobileeee (e-Carsharing data)
Modality (Container management system)
Modbus (Building Management System)
MOL BuBi (Hungarian bike sharing platform)
MQTT (generic MQTT Receiver)
Mr. Fill (Smart Trash bins)
Munisense (Noise sensors)
Netatmo (Environmental Sensors)
nextbike (Bike sharing platform)
Node Red (Data flow system)
NXP (RFID tag data)
NYC Traffic (Traffic detector & signal state data)
OCIT-C (Standard for Traffic Management Systems)
OCPI Last Mile Solutions (EV charging)
Olbring (water level sensors)
One M2M (cloud-to-cloud connector)
OpenWeatherMap (Weather data)
OWLET Nightshift (Luminaire status and energy consumption data)
OWLET IOT (Luminaire status and energy consumption data)
Philips City Touch (Smart Lighting)
Pimcore Plattform (Asset Management)
Public Wifi (generic Wifi Locations)
Purple Air (Environmental Sensors)
Purple Wifi (Smart WiFi System)
RhineCloud (Parking data)
Reekoh (cloud-to-cloud connector)
RMV (Public Transport in Hessian, Germany)
RTB Verkehrstechnik (Traffic counting systems)
Ruckus (Smart WiFi System)
RUDIS (cloud-to-cloud connector)
SAP Open e-Mobility (Charging Stations)
Scheer (Energy management)
Schréder EXEDRA (Smart Lighting)
Screen scraper (Data extraction from websites)
SCC geoserver (spatial data)
SCC Solarfarm (PV and weather data)
Scheidt & Bachmann (parking data)
Scoot (Adaptive Traffic Control Systems)
Seeketing Observer (Pedestrians frequency)
Sensoterra (ground moisture)
SensorThings (Open Geospatial Consortium-Standard)
Sentry (MQTT broker)
SIEMENS SENTRON (Energy Monitoring & Power Distribution)
SIEMENS (Traffic Management Systems)
Smart City Systems (Parking Data)
Smart Link (Irrigation data)
Spot (Environmental Sensors)
SPP Analytics (Signal Phase Timings)
Stadtwerke Aalen (Parking management)
Sustainder Brokerage (Smart Lighting)
SWARCO KR (Traffic Management System)
SWARCO TMS (Traffic Management System)
Swisstraffic (Traffic detector data)
Tier Mobility (Scooter Sharing)
Tom Tom (Traffic data)
Translink (Public transport data)
Tüga Plusportal (Smart Wifi System)
TVILIGHT (Smart Lighting)
[ui!] TRAFFIC (inner City traffic density)
Vaisala (Environment – receives pushed data)
Vaisala beacon cloud (Environment sensors)
Vaisala Mobile Detector (road conditions)
Vaisala WX Horizon (road conditions)
Vaisala Xweather (Environment sensors)
VDH (Traffic counting & video)
Vivacity Labs Tracks (Traffic management)
Vivacity Labs V2 (Traffic management)
Vivarium (Smart Zoo)
Viom Floating Car Data (FCD)
WaveScape (Crowd based sound measurement platform)
Wikidata (City Info)
Wordpress (Newsfeed)
YellowMap (Charging stations in Germany)
Ymatron (Waste bin data)
Zenner ElementIoT (LoRaWAN network server)
Zendesk (Ticketing system)
Zeta (Charging controller)
ZTIX (Event Calendar)

Weitere Konnektoren sind aktuell in der Entwicklung…

Get started right away - With the data from [ui!]

To use the [ui!] ENVIRONMENT solution, you don't have to fulfil any complicated requirements, you can simply get started. We take care of the installation, connection and operation of the Urban Data Platform, the [ui!] COCKPIT and the [ui!] DATALABs.

If you would like to integrate a logo or coat of arms of the city to be displayed in your municipal [ui!] ENVIRONMENT dashboard, please send it to us in SVG format. The obligation to provide data applies to optional existing sensors, e.g. for recording consumption data or environmental measurements. If the data is not publicly accessible, we may need the access data to the respective systems from you - this includes either a specially set up user account or an API key (new development may be necessary if no existing connector exists in the [ui!] connector catalogue).

We also have an overview at [ui!] of which data is publicly accessible and can be used for your objectives after checking (e.g. publicly accessible level measurement data from the Hessian State Agency for Nature Conservation, Environment and Geology (HLNUG) for local authorities in Hesse).

Soil moisture monitoring

The soil moisture monitoring function module uses soil moisture sensors to monitor soil moisture, e.g. in municipal green spaces or on certain urban trees. This is becoming increasingly important, especially against the background of climate change-related and more frequent hot summers and droughts. This function module enables you to:

  • The data obtained from the soil moisture sensors enables municipal green spaces to be watered in a much more needs-orientated and therefore resource-saving manner.

  • Identify measures for climate change adaptation, check their effectiveness and thus improve the quality of life in the municipality.

Added value in municipal use

Added value in municipal use

The [ui!] soil moisture monitoring function module creates added value for both the administration and the citizens of your municipality:

  • The information is used by the employees of the Parks Department (or a comparable administrative unit) to create a data basis on soil moisture in order to plan routes for employees more intelligently in the short term and use resources sparingly.
  • Demand-led irrigation can ensure that plant damage is prevented by sufficient irrigation, while also preventing over-watering.
  • On the other hand, long-term forecasts (additional service: forecasting service) can be created for efficient route planning, which further increases the city's efficiency.

In concrete figures, this means

  • Depending on the summer, at least 14-18 watering trips per tree are necessary, and even more for young trees in hot summers. At a cost of around €20 per trip, the annual costs quickly add up to €300 per tree. The majority of the costs are not so much due to the amount of water, but to the journeys with the irrigation vehicle and the associated labour costs.
  • By using sensor technology for soil moisture monitoring in combination with decentralised tanks, water logistics can be reduced to 2 trips per year (€40 total per tree per year).

The city of Bad Nauheim has been using the technology since 2023 to provide a data basis for the responsible employees. Live data on soil moisture is sent several times a day via the city's LoRaWAN network to the Open Urban Data Platform, where it is processed and visualised for the responsible employees via the specialist application, [ui!] DATALAB. This creates a data basis on which the scarce human resources can be deployed in a targeted manner.

Selection [ui!] DATALAB

Selection [ui!] DATALAB

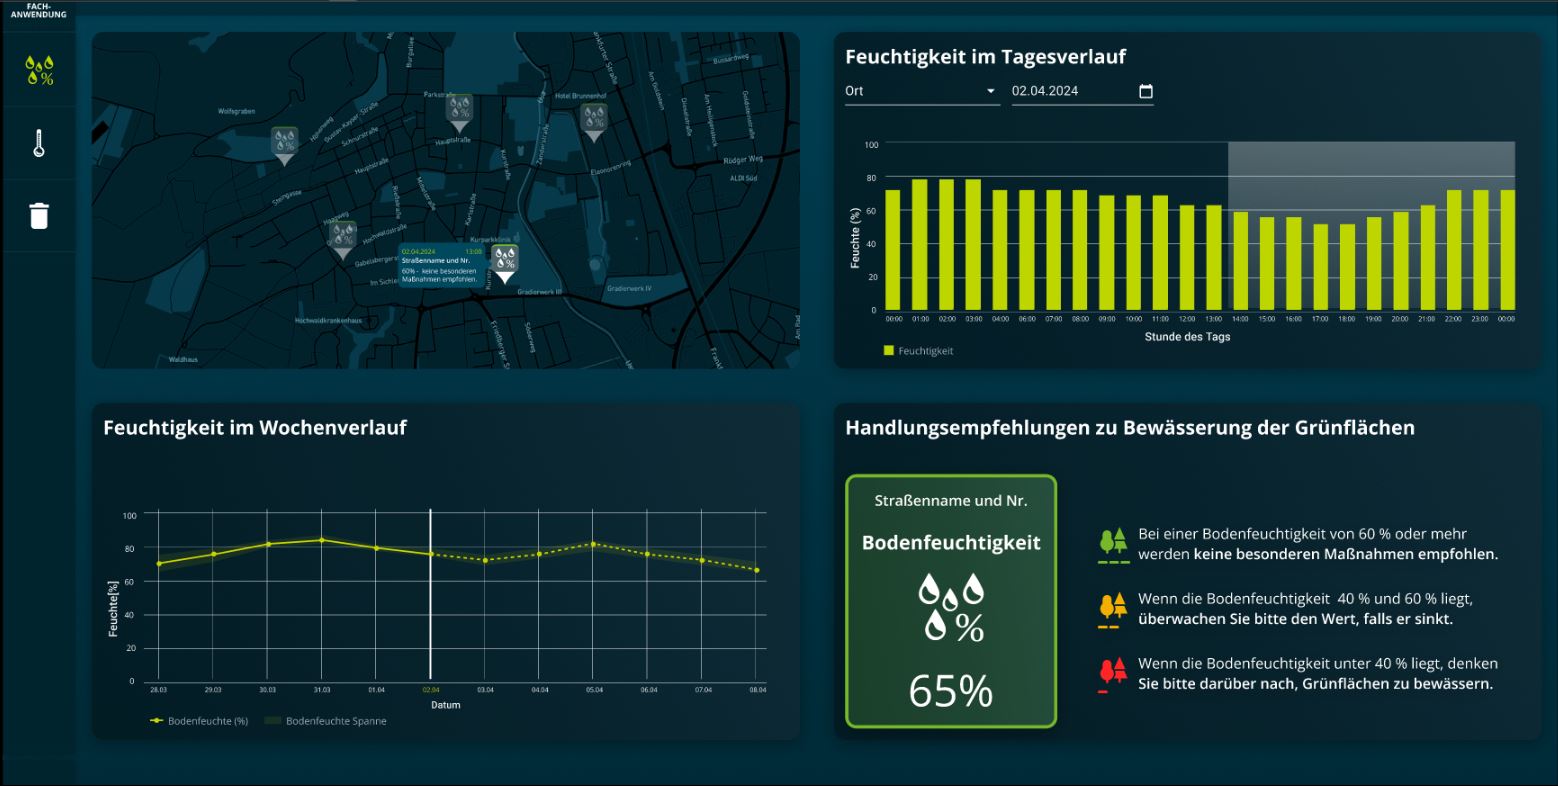
The specialised application [ui!] DATALAB for the soil moisture monitoring function module clearly displays relevant information on this topic. The sensors are displayed geo-localised on a map so that users have an overview of them at all times.

The measured data on soil moisture and temperature over the course of the day is displayed as a bar chart. Data over a longer period of time (week) is visualised as a line chart.
*** Translated with www.DeepL.com/Translator (free version) ***

Technical description

Technical description

This function module requires the [ui!] UrbanPulse open urban data platform including a [ui!] COCKPIT as an existing component in order to utilise the full scope of the solution.

With its connector architecture, the data platform allows the integration of a wide variety of data sources. Furthermore, installed sensors for soil moisture are taken as a given (No sensors available? Find out here: agora.umi.city/de/infrastruktur).

Sensors are connected via a connector. If no [ui!] connector is available, this must be ordered and developed separately.

As soon as your [ui!] UrbanPulse is active, you meet the requirements to start visualising data for citizens and specialist users. Existing connectors A connector is already available that can be used to record soil moisture using Watermarks sensors.

There are also a number of connectors available in the [ui!] connector catalogue. If your desired connector is not yet available in our catalogue, we will be happy to develop a suitable connector for you. Please get in touch with us.

Air quality monitoring

The air quality monitoring function module includes the measurement of air quality, e.g. at road junctions, in tunnels or, if necessary, across entire urban areas. Continuous monitoring allows the progression of air quality to be visualised in interactive graphs. This is particularly important for local authorities in the context of urban air pollution control.

This function module allows you to ...

  • interactive visualisation of air quality over different time periods, allowing users to focus on specific processes and take a closer look at details. Furthermore, different predefined aggregations can be selected and visualised over a freely definable time period.

  • legal threshold values, such as those stipulated in the Federal Immission Control Act (BImSchV), can be observed in the urban data platform and exceedances automatically marked separately. In addition, notifications can be sent automatically by email to defined recipients if threshold values are exceeded. Citizens can also be informed about the current status of air quality via a tile or directly on the map.


Added value in municipal use

Added value in municipal use

The analysis results of the air quality monitoring function module have an impact on various aspects of urban life and environmental protection:

  • Monitor the impact of traffic: Air quality sensors can be installed at busy roads, junctions and tunnels to accurately measure the impact of traffic on air quality. This data enables city authorities to take targeted measures to control traffic and reduce air pollution, thereby protecting the health of citizens.
  • Industrial site monitoring: By installing air quality sensors near industrial plants and production facilities, emission limits can be monitored and environmental impact minimised. If limit values are exceeded, immediate measures can be taken to reduce emissions and minimise the environmental impact.
  • Creating an attractive living environment: Air quality monitoring is used in residential areas to protect the health and well-being of residents. By installing air quality sensors, exposure to air pollutants can be closely monitored and targeted measures can be taken to improve air quality in order to increase the quality of life of neighbouring residents.
  • Protect social infrastructures: In addition, air quality monitoring is also crucial in healthcare facilities such as hospitals, care centres and schools. By integrating air quality sensors, the health of patients, residents and pupils can be protected and the risk of airborne diseases minimised. This helps to create a healthy environment for everyone and improve the quality of healthcare.

You can use this function module to plan your measures for compliance with the legal requirements for air pollution control on the basis of data:

  • Directive 2008/50/EC of the European Parliament and of the Council of 21 May 2008 on ambient air quality and cleaner air for Europe provides the regulatory framework that transposes Directive 2008/50/EC into German law in Germany through Ordinance BImSchV 39 (39th Ordinance on the Implementation of the Federal Immission Control Act). A primary objective is to prevent or reduce the harmful effects of air pollutants on human health and the environment and to provide the population with comprehensive information on air quality.

  • With the help of air quality sensors that can measure pollutants such as ozone (O3), nitrogen dioxide (NO2) and particulate matter (PM10), compliance with the emission limits set by the Federal Environment Agency (UBA) can be transparently measured and reported. They make it possible to monitor compliance with the statutory limit values and to be informed if a limit value has been exceeded or is about to be exceeded so that countermeasures can be initiated if necessary, such as the closure of road sections to heavy goods vehicles.

The information on air quality can also provide all citizens with a picture of the situation, e.g. to avoid dangerous "hot spots" in the event of health problems.

  • In a medium-sized city, for example, it is estimated that around 580 disability-adjusted life years (DALYs) are lost every year due to air quality. According to a study published in 2020 by the European Public Health Alliance (EPHA), air pollution in Germany costs €1,468 per city dweller every year. For a medium-sized city (200,000 inhabitants), a 1% reduction in air pollution could save costs of €2,936,000 per year.

However, smaller municipalities can also be affected by poor air quality due to their location or transport links. There is often a lack of suitable measuring stations here. For example, lightweight air quality sensors such as those offered on the [ui!] AGORA smart city marketplace (https://agora.umi.city) can be set up as measuring points.

Selection [ui!] DATALAB

Selection [ui!] DATALAB

The [ui!] DATALAB specialist application for the air quality monitoring function module shows the data of all connected sensors that are deployed in the cityscape and connected to the data platform via wireless networks, geo-localised on a map so that users can navigate quickly and easily to the respective sensor. The current values of the sensor over time can be displayed directly by selecting a sensor. In addition, the data is analysed and displayed in accordance with the requirements of the 39th BImSchV.

[ui!] DATALAB Luftqualitätsmonitoring mit Sensoren auf einer Karte

[ui!] DATALAB inkl. der Darstellung der Luftqualität mit Pins auf einer Karte.

[ui!] DATALAB Luftqualitätsmonitoring mit 6 Messwerte der Sensoren

[ui!] DATALAB inkl. der Darstellung der Luftqualität mit einer Darstellung der Detailinformationen an der Seite.

Technical description

Technical description

This function block requires the open urban data platform [ui!] UrbanPulse as an existing component. Furthermore, installed sensors for soil moisture are assumed as given (No sensors available? Inform here https://agora.umi.city/de/infrastruktur).

The sensors are connected via a connector. If no [ui!] connector is available, this must be ordered and developed separately. As soon as your Open Urban Data Platform is active, you meet the requirements to start visualising data for citizens and specialist users.

At the moment, the measuring stations of the Hessian State Agency for Nature Conservation, Environment and Geology (HLNUG) and sensors from Vaisala can be integrated. A number of other connectors are also available in the [ui!] connector catalogue. If your desired connector is not yet available in our catalogue, we will be happy to develop a suitable connector for you. Please get in touch with us.

Level monitoring

The water level monitoring function module collates data from sensors at water points, which is crucial for general environmental monitoring and disaster prevention. This monitoring of water levels is becoming increasingly important for local authorities - especially with regard to the ability to react quickly to increasing heavy rainfall events caused by climate change.

This function module enables you to ...

  • Your own data-based early warning system for extreme weather events Early and data-based information on possible flooding can save lives and protect property more efficiently in extreme cases, as your responsible authorities are enabled to act proactively instead of reactively. Specifically, changes in water levels are recorded at an early stage using special sensors and visualised in the development so that you can take proactive measures if necessary.

  • to dock the sensor-based water monitoring to existing data sources. The data from the sensors is sent to a central server via LoRaWAN wireless technology and transmitted from there to the open urban data platform [ui!]Urban Pulse. The [ui!]UrbanPulse also allows you to integrate data from state or federal authorities, for example, in order to make the data available for your decision-making even more comprehensive.

Added value in municipal use

Added value in municipal use

The water level monitoring function module is used in various municipal areas and is of crucial importance for the management of water resources and protection against natural hazards. Here is an overview of the added value of this function module:

  • Effective flood protection and flood management: Continuous monitoring of water levels enables early warning of impending floods. This allows the authorities to take measures in good time to minimise the risk to residents and protect property. The data can also be made available to citizens, so that the recognition of potentially dangerous situations is also supported by swarm intelligence from the population.

  • Sustainable river and water ecology: Monitoring water levels helps to record changes in water levels and understand their impact on ecology, which is of great importance for nature conservation.

  • Optimise water management and water supply: Monitoring water levels makes it possible to ensure the availability of water resources and regulate the flow of water in rivers and canals. This is particularly important during dry periods or when irrigating agricultural land.

  • Safety in shipping and transport: Water level monitoring is essential to ensure the safety of waterways, as water levels are used to determine water depth and enable ships to navigate.
Selection [ui!] DATALAB

Selection [ui!] DATALAB

The [ui!] DATALAB specialist application for the water level measurement function module displays the data of all connected sensors that are deployed in the cityscape and connected to the data platform via wireless networks, geolocalised on a map so that users can quickly and easily navigate to the respective sensor.

The current values of the sensor over time can be displayed directly by selecting a sensor. Time periods can be selected using the filter options. In addition, the water levels over the course of the week are displayed in the form of a line graph.

[ui!] DATALAB Pegelstandsmessung

Technical description

Technical description

This function block requires the open urban data platform [ui!] UrbanPulse as an existing component. Furthermore, installed sensors for soil moisture are assumed as given (No sensors available? Inform here: https://agora.umi.city/de/infrastruktur). Sensors are connected via a connector. If no [ui!] connector is available, this must be commissioned and developed separately.

As soon as your Open Urban Data Platform [ui!] UrbanPulse is active, you meet the requirements to start visualising data for citizens and specialist users.

Existing connectors
A range of connectors are available for the function module in the [ui!] connector catalogue. If your desired connector is not yet available in our catalogue, we will be happy to develop a suitable connector for you. Please get in touch with us.

Noise monitoring

With the noise monitoring function module, noise development is recorded by installing noise sensors at specific road junctions, train routes or, if necessary, across large areas.

This function module enables you to ...

  • to use continuous noise monitoring to detect localised exceedances of limit values and initiate targeted countermeasures that improve the quality of life and satisfaction of citizens in your municipality.
  • define legal limits in your Open Urban Data Platform and be automatically notified if they are exceeded.
  • differentiate local noise emissions according to their sources.

In contrast to publicly available noise maps, which are usually based on calculated models, the noise monitoring function module uses actual measured values and is therefore superior to these in terms of the specific situation on site.


Added value in municipal use

Added value in municipal use

The noise monitoring analysis results cover a wide range of applications, all aimed at monitoring and controlling noise exposure in different environments. Based on this data, you can generate a range of added value for your municipality:

  • Optimise traffic control: In urban areas, monitoring is often used to record noise development at busy road junctions and to take measures to control traffic (environmentally sensitive traffic management).

  • Planning noise protection measures: Monitoring along railway lines is important in order to minimise the impact of rail traffic on the surrounding communities and improve the quality of life of local residents. In industrial areas, noise sensors are used to monitor noise pollution from industrial activities and ensure that legal limits are adhered to.

  • Protect sensitive uses: In addition, noise sensors are also used in leisure and recreational areas, residential areas and school and educational facilities to protect people's peace and relaxation and create a pleasant environment.

This wide range of applications emphasises the versatility and importance of noise monitoring for the quality of life and environmental protection in urban and rural areas. Noise monitoring also enables you to plan your measures to comply with legal requirements regarding noise emissions on the basis of data.

  • With the Environmental Noise Directive 2002/49/EC, the European Union has reached an important milestone towards comprehensive regulation of noise immissions. The Federal Immission Control Ordinance (BImSchV) stipulates that noise reports and action plans must be drawn up in order to be able to take long-term action against noise pollution.

  • Paragraphs 47 c and 47 d of the BImSchV oblige the responsible authorities to draw up "noise maps" and "noise action plans". Measuring equipment can be included in the noise action plans specifically for noise conflict zones. Political discussions and complaints from neighbouring residents can be conducted on a factual basis using actual measured values.
Selection [ui!] DATALAB

Selection [ui!] DATALAB

The specialised application [ui!] DATALAB for the noise monitoring function module shows the noise emission measurements over the course of the week in a line diagram, including a forecast for the next few days. On the other hand, the hourly averages can be clearly displayed as a bar chart. Forecasts of the noise level at selectable locations with an additional forecast for tomorrow and the day after tomorrow are displayed to the user in the form of gauge charts, i.e. a radial scale.

Technical description

Technical description

This noise monitoring function module requires the open urban data platform [ui!] UrbanPulse as an existing component. Furthermore, installed sensors for soil moisture are assumed to be present.

(No sensors available? Inform here agora.umi.city.

Sensors are connected via a connector. If no [ui!] connector is available, this must be ordered and developed separately.

As soon as your Open Urban Data Platform [ui!] UrbanPulse is active, you meet the requirements to start visualising data for citizens and professional users.

Existing connectors

A range of connectors are available for the function module in the [ui!] connector catalogue. If your desired connector is not yet available in our catalogue, we will be happy to develop a suitable connector for you. Please get in touch with us.

Would you like to find out more about our solutions?

We are also available for a demonstration at our branches in Berlin, Darmstadt, Munich, Walldorf or Chemnitz or will be happy to visit you on request.