[ui!] TRAFFIC

Smart traffic optimisation for your municipality

Kurzinformation

  • Added value for citizens
  • Implementing digitalisation
  • Smart transport planning
  • Improved environmental management
  • Decision support for transport planning and
    -optimisation.
  • Seamless integration of existing and new urban systems
  • AI-based traffic analyses

From data to action - practical transport solutions for your municipality: [ui!] TRAFFIC

Transport concerns us all - whether for business, pleasure or both. Intelligent mobility is at the centre of every smart city strategy, and every city dweller perceives the offers and effects of transport in their everyday lives. Transport is therefore also a decisive lever for making political effectiveness and effective administrative action tangible for city dwellers.

At the same time, digital technologies offer previously unimagined opportunities to organise transport more efficiently and in line with demand. By analysing vehicle position data, bottlenecks in the road network can be identified and eliminated in a targeted manner, while parking guidance systems with sensors display free parking spaces in real time. This reduces traffic searching for parking spaces, which in turn reduces emissions and improves the quality of life for citizens.

With [ui!] TRAFFIC, we offer you a comprehensive portfolio of solutions to realise these and other potentials for your municipal traffic management and planning.

[ui!] TRAFFIC focuses on issues relating to flowing traffic and provides analysis and visualisations for this purpose. This primarily comprises the following overarching objectives:

- Provision of up-to-date traffic information for citizens

- Provision of analysis tools for specialised users

- Seamless integration of urban systems into higher-level platforms


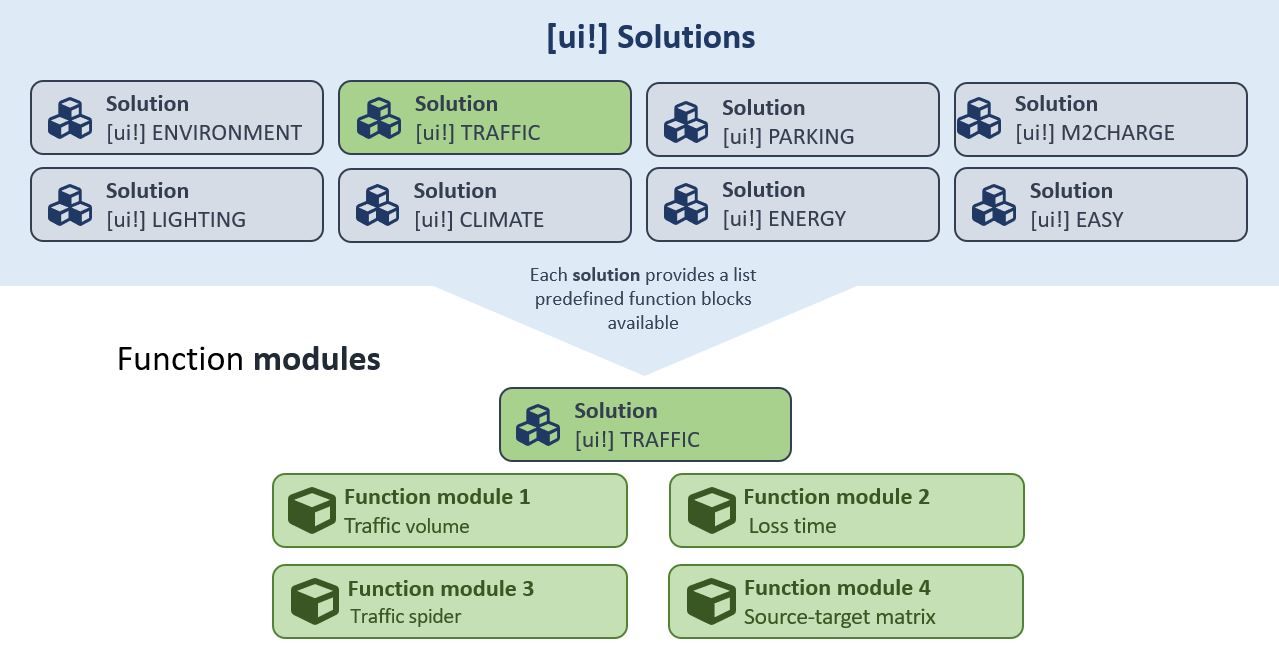
[ui!] TRAFFIC is made up of the four functional modules traffic volume, loss times, traffic spider and source-destination matrix and covers typical traffic planning issues.

The best thing about it is that you receive these basic findings and decision-making aids without having to carry out extensive measurements or complex traffic planning analyses.

For [ui!] TRAFFIC we use position data sent by vehicles, so-called Floating Car Data (FCD).
This data describes the movement of vehicles on the road network. It is a data type with a common standard in the transport sector. The data is available to [ui!] for the whole of Germany and is used to create the desired analyses.

[ui!] TRAFFIC at a glance

The [ui!] TRAFFIC solution is made up of the four function modules:

  • Traffic volume
  • Lost time
  • Traffic spider
  • Source-destination matrix

Each of these modules deals with a specific issue in the context of moving motor vehicle traffic.

Standards and cooperation

The digitalisation of the public sector generates municipal data as part of digital applications and municipal infrastructures using digital measurement and control devices. This data is often stored in silos of municipal infrastructures and is used in a specialised and isolated manner.

By using an open urban data platform in accordance with DIN SPEC 91357, these can be securely brought together in one central location.

The [ui!] TRAFFIC portfolio of function modules is based on the open urban data platform [ui!] UrbanPulse.

Data can be combined from different data sources and visualised in a targeted manner in order to create the tools for a comprehensive picture of a municipality's key environmental concerns.

As a central component of municipal urban development, [ui!] ENVIRONMENT with its environmental data is an excellent link to the [ui!] TRAFFIC and [ui!] PARKING solutions.

In combination, these solutions provide you with a comprehensive picture of your municipality's key environmental concerns and are suitable building blocks for implementing your environmental strategy on the basis of solid data.

Visualisation and decision support

At [ui!], we believe that municipal digitalisation must be considered and communicated holistically. That's why our solutions ensure that the evaluation results can be visualised both internally and externally.

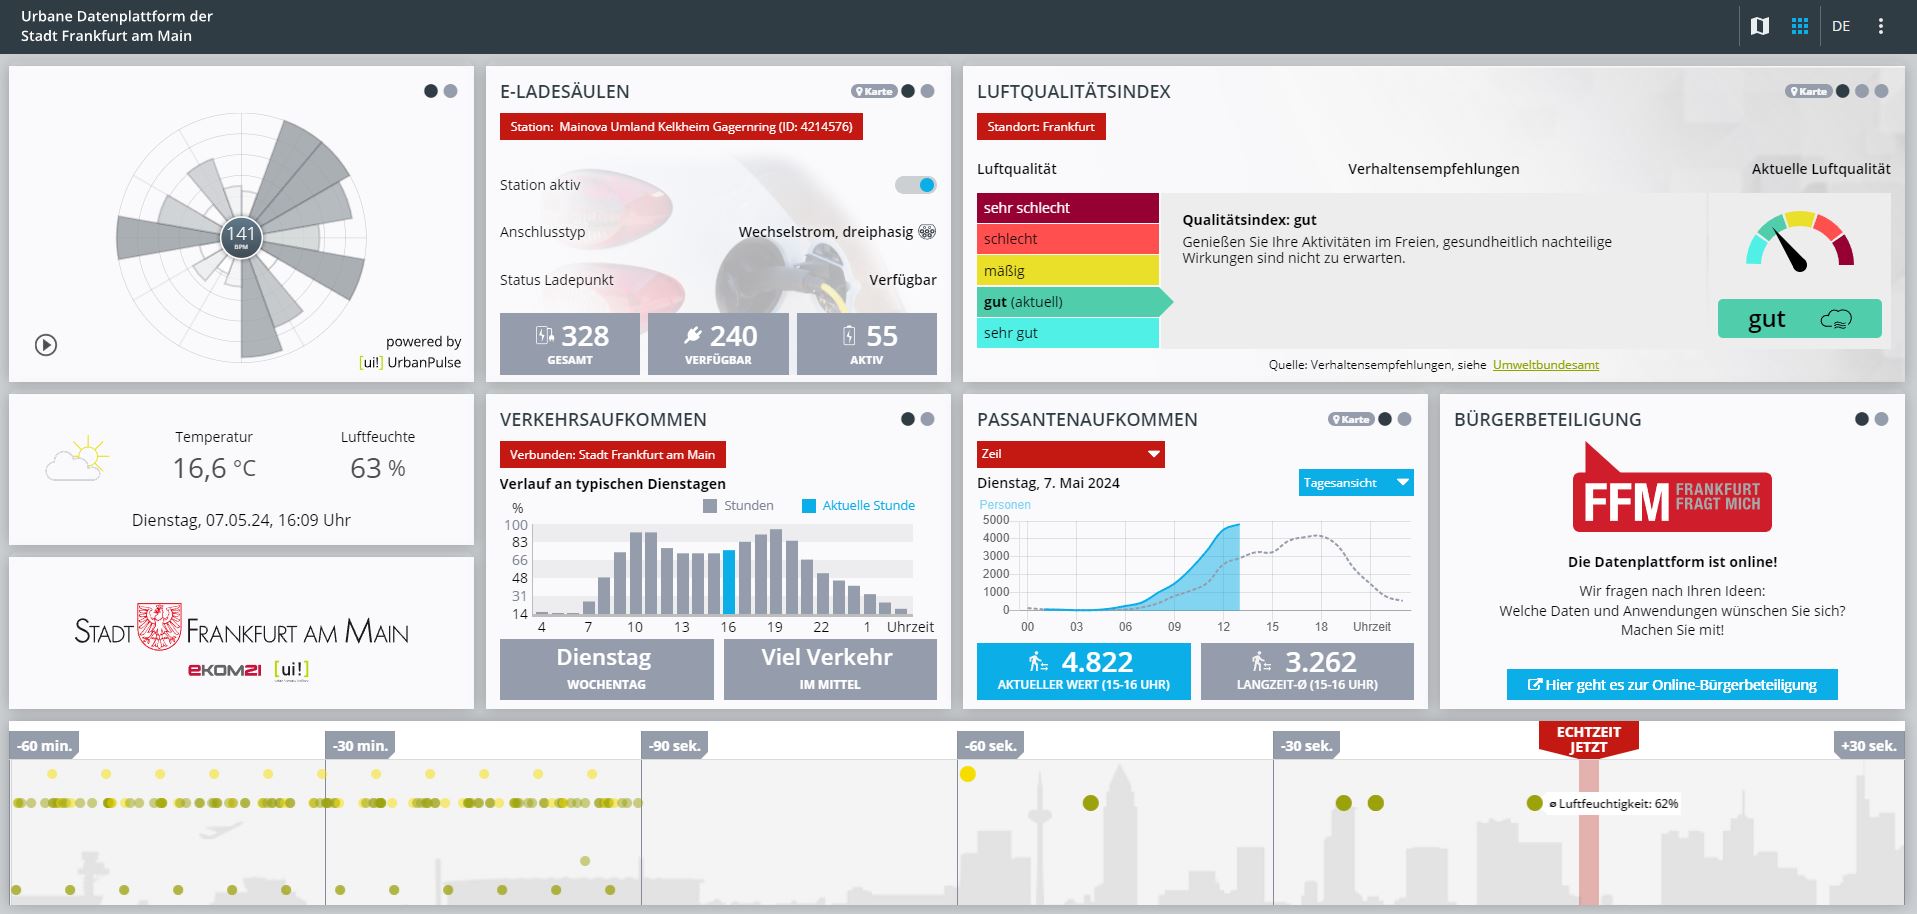
  • The [ui!] COCKPIT is the option for visualising processed data for citizens. With the help of a public smart city cockpit, you can provide the public with aggregated information about the local environment.

    COCKPIT Frankfurt

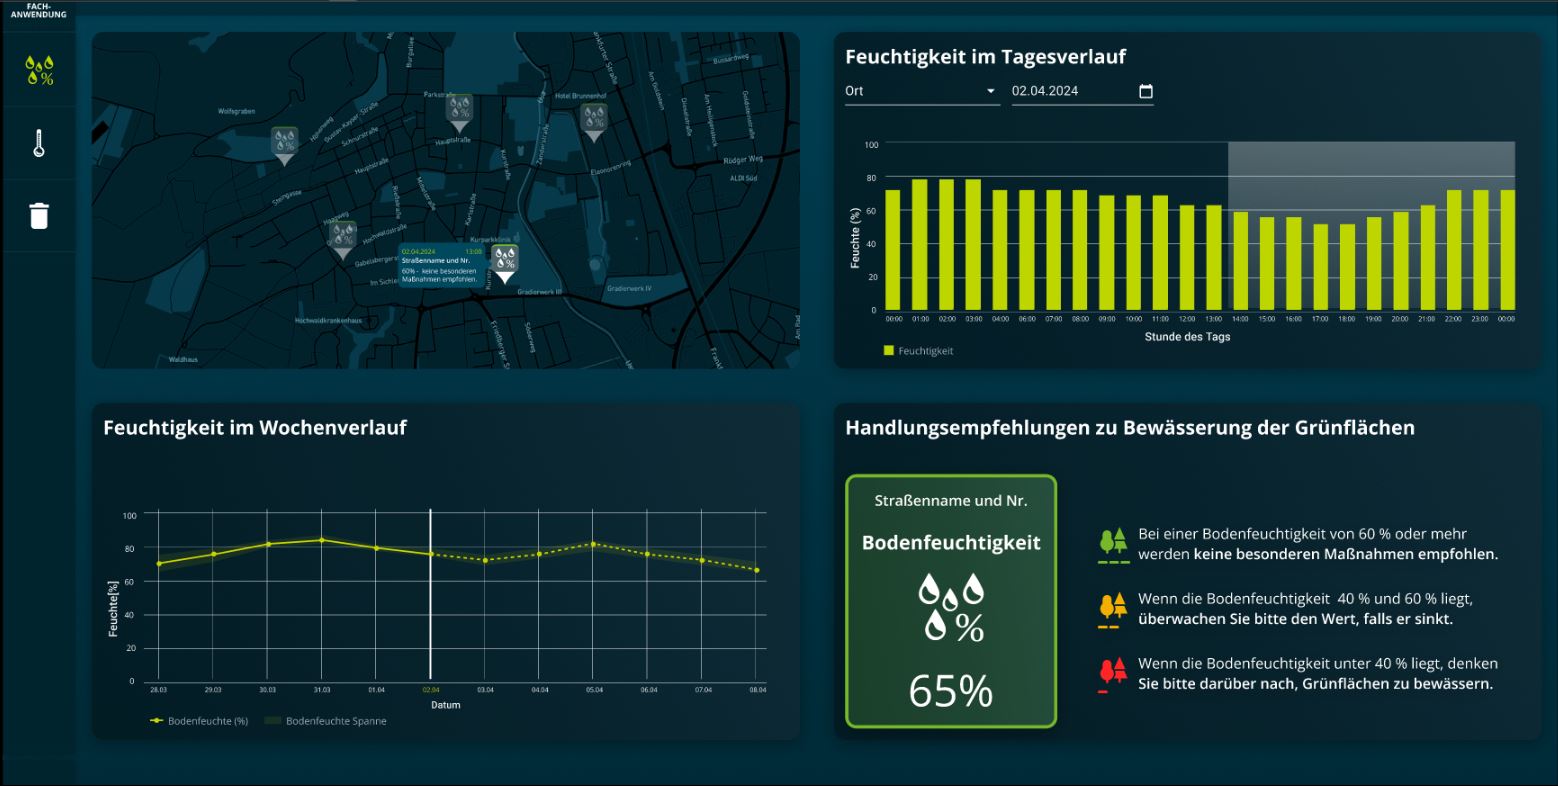
  • The [ui!] DATALAB is the tool for advanced environmental data analyses that provides specialist users with a municipal situation picture (e.g. climate managers, digitalisation department, and many others). It integrates seamlessly into [ui!] UrbanPulse and thus promotes cross-departmental collaboration.

    COCKPIT Frankfurt

Connection and connectors

If external data from existing systems or in-house sensor technology is to be integrated, it must be connected to the Open Urban Data Platform via a so-called connector.

Konnektorenliste

All of our tested and preconfigured use cases can be selected from our standard set of use cases for specific topics.

The prerequisite is that your data sources can be connected with existing connectors from our [ui!] connector library.

The visualisation, which is based on the standard tile catalogue without any changes, is preconfigured by you using the configurator and then created for you by us.

If no connector is available for your desired system, we can develop one for you. Please discuss this option with us directly.

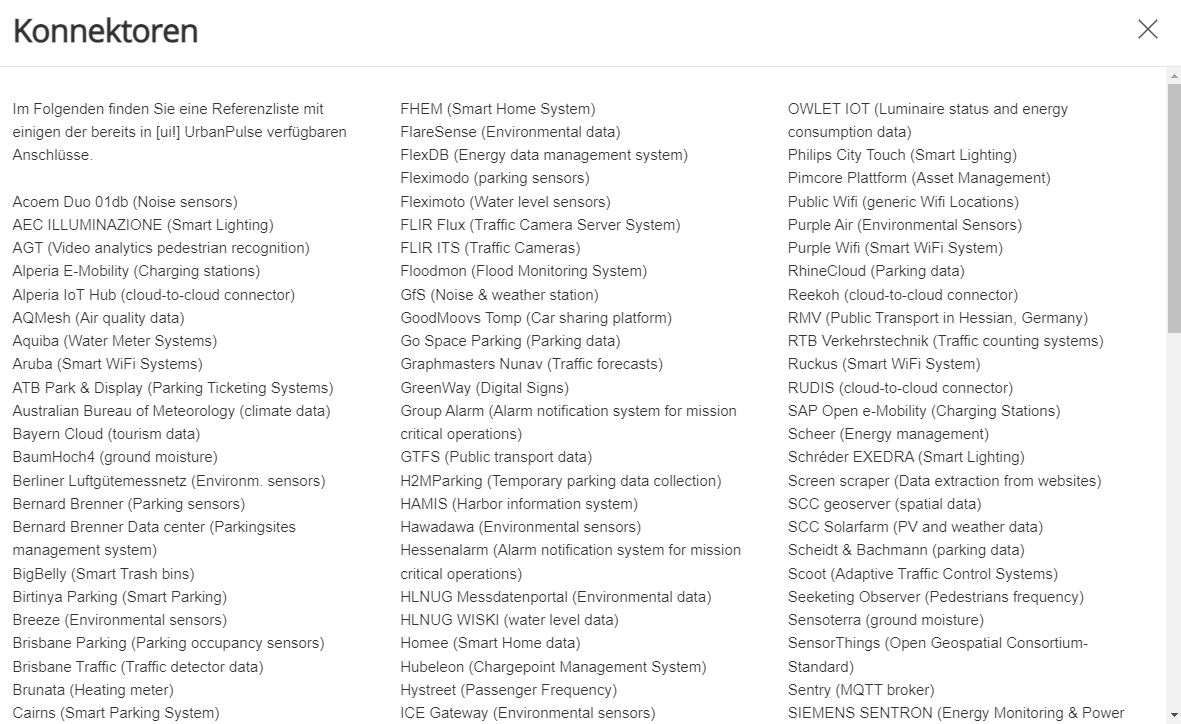
Connectors

Below you will find a reference list of some of the connections already available in [ui!] UrbanPulse.

Acoem Duo 01db (Noise sensors)
AEC ILLUMINAZIONE (Smart Lighting)
AGT (Video analytics pedestrian recognition)
Alperia E-Mobility (Charging stations)
Alperia IoT Hub (cloud-to-cloud connector)
AQMesh (Air quality data)
Aquiba (Water Meter Systems)
Aruba (Smart WiFi Systems)
ATB Park & Display (Parking Ticketing Systems)
Australian Bureau of Meteorology (climate data)
Bayern Cloud (tourism data)
BaumHoch4 (ground moisture)
Berliner Luftgütemessnetz (Environm. sensors)
Bernard Brenner (Parking sensors)
Bernard Brenner Data center (Parkingsites management system)
BigBelly (Smart Trash bins)
Birtinya Parking (Smart Parking)
Breeze (Environmental sensors)
Brisbane Parking (Parking occupancy sensors)
Brisbane Traffic (Traffic detector data)
Brunata (Heating meter)
Cairns (Smart Parking System)
Cambio (Car sharing platform)
Casambi (Smart Lighting)
Chargecloud (Charging stations)
ChargeIt (Charging data)
ChargePointOperator (OCPI Charging data)
Cisco Meraki (Smart WiFi Systems)
Civento (Construction Sites)
Clean City Networks (Waste bin data)
Cleverciti OffStreet (Parking Management)
Cleverciti OnStreet (Parking Management)
Cleverciti Ticks (Parking Management)
Cologne Parking (Parking garages data)
Cologne Traffic (Traffic flow data, Traffic Obstructions)
Comark Laser Scanner (Bike detection sensors)
Connctd IoT (Smart Home System)
Continental Carsharing (Car sharing platform)
Corona Incidence Report (COVID-19 Situation)
Count and Care (MQTT connector)
Crossfleet (Car sharing platform)
CSV Data (generic data import)
Datex II (traffic data)
DB ParkSpace (Parking Data)
DB Flinkster (Car Sharing)
DB Call a Bike (Bike Sharing
DEFAS (Public Transport data)
DFKI onboard Unit (Car Telemetry Interface)
Discovergy (Smart Meter data)
Duo Smart Noise (Noise sensors)
Eco-counter (Traffic count data)
e-sensio urban SmartBox (Environmental Sensors)
EarthSense (Air Quality)
EDIFACT MSCONS (Energy Data)
Eluminocity (Charging data)
Emio (Environmental sensors)
EnBW Sm!ght (Smart lamp post, Environmental Sensing & EV Charger)
Enevo (Waste bin data)
e-netz InfoMap (Construction Sites)
Entega (Energy Distribution Grid)
Feratel (Event Calendar)
FHEM (Smart Home System)
FlareSense (Environmental data)
FlexDB (Energy data management system)
Fleximodo (parking sensors)
Fleximoto (Water level sensors)
FLIR Flux (Traffic Camera Server System)
FLIR ITS (Traffic Cameras)
Floodmon (Flood Monitoring System)
GfS (Noise & weather station)
GoodMoovs Tomp (Car sharing platform)
Go Space Parking (Parking data)
Graphmasters Nunav (Traffic forecasts)
GreenWay (Digital Signs)
Group Alarm (Alarm notification system for mission critical operations)
GTFS (Public transport data)
H2MParking (Temporary parking data collection)
HAMIS (Harbor information system)
Hawadawa (Environmental sensors)
Hessenalarm (Alarm notification system for mission critical operations)
HLNUG Messdatenportal (Environmental data)
HLNUG WISKI (water level data)
Homee (Smart Home data)
Hubeleon (Chargepoint Management System)
Hystreet (Passenger Frequency)
ICE Gateway (Environmental sensors)
INCOTEC (Passenger Frequency)
INRIX (Parking data)
Intelliport IPS-403 NB-IoT (Traffic Sensor)
JSON Schema (generic data import)
KairosDB (Timeseries Database Connector)
Kerlink LoRa IoT Station (LoRaWAN Gateway)
Kimley Horn KITS (Traffic data)
Klimaherzen (CO2-Savings Incentive system)
KNX (Building Management System)
KVB (Public transport station data)
LanUV (NRW environment data)
Las Vegas Traffic (Traffic detector & signal state data)
Libelium Plug&Sense Smart City (Sensor devices)
Libelium Plug&Sense Smart Environment (Sensor devices)
Libelium Plug&Sense Smart Environment Pro (Sensor devices)
LuenNi (Niedersachsen environment data)
manageE (per second energy meter)
Marine traffic (Ship monitoring system)
MDM (moblity data marketplace)
Mobileeee (e-Carsharing data)
Modality (Container management system)
Modbus (Building Management System)
MOL BuBi (Hungarian bike sharing platform)
MQTT (generic MQTT Receiver)
Mr. Fill (Smart Trash bins)
Munisense (Noise sensors)
Netatmo (Environmental Sensors)
nextbike (Bike sharing platform)
Node Red (Data flow system)
NXP (RFID tag data)
NYC Traffic (Traffic detector & signal state data)
OCIT-C (Standard for Traffic Management Systems)
OCPI Last Mile Solutions (EV charging)
Olbring (water level sensors)
One M2M (cloud-to-cloud connector)
OpenWeatherMap (Weather data)
OWLET Nightshift (Luminaire status and energy consumption data)
OWLET IOT (Luminaire status and energy consumption data)
Philips City Touch (Smart Lighting)
Pimcore Plattform (Asset Management)
Public Wifi (generic Wifi Locations)
Purple Air (Environmental Sensors)
Purple Wifi (Smart WiFi System)
RhineCloud (Parking data)
Reekoh (cloud-to-cloud connector)
RMV (Public Transport in Hessian, Germany)
RTB Verkehrstechnik (Traffic counting systems)
Ruckus (Smart WiFi System)
RUDIS (cloud-to-cloud connector)
SAP Open e-Mobility (Charging Stations)
Scheer (Energy management)
Schréder EXEDRA (Smart Lighting)
Screen scraper (Data extraction from websites)
SCC geoserver (spatial data)
SCC Solarfarm (PV and weather data)
Scheidt & Bachmann (parking data)
Scoot (Adaptive Traffic Control Systems)
Seeketing Observer (Pedestrians frequency)
Sensoterra (ground moisture)
SensorThings (Open Geospatial Consortium-Standard)
Sentry (MQTT broker)
SIEMENS SENTRON (Energy Monitoring & Power Distribution)
SIEMENS (Traffic Management Systems)
Smart City Systems (Parking Data)
Smart Link (Irrigation data)
Spot (Environmental Sensors)
SPP Analytics (Signal Phase Timings)
Stadtwerke Aalen (Parking management)
Sustainder Brokerage (Smart Lighting)
SWARCO KR (Traffic Management System)
SWARCO TMS (Traffic Management System)
Swisstraffic (Traffic detector data)
Tier Mobility (Scooter Sharing)
Tom Tom (Traffic data)
Translink (Public transport data)
Tüga Plusportal (Smart Wifi System)
TVILIGHT (Smart Lighting)
[ui!] TRAFFIC (inner City traffic density)
Vaisala (Environment – receives pushed data)
Vaisala beacon cloud (Environment sensors)
Vaisala Mobile Detector (road conditions)
Vaisala WX Horizon (road conditions)
Vaisala Xweather (Environment sensors)
VDH (Traffic counting & video)
Vivacity Labs Tracks (Traffic management)
Vivacity Labs V2 (Traffic management)
Vivarium (Smart Zoo)
Viom Floating Car Data (FCD)
WaveScape (Crowd based sound measurement platform)
Wikidata (City Info)
Wordpress (Newsfeed)
YellowMap (Charging stations in Germany)
Ymatron (Waste bin data)
Zenner ElementIoT (LoRaWAN network server)
Zendesk (Ticketing system)
Zeta (Charging controller)
ZTIX (Event Calendar)

Further connectors are currently under development...

Get started right away - With the data from [ui!]

All [ui!] TRAFFIC function modules are based on analysing data that is already available to us, so you do not need to tap into any other data sources to use our solutions.

Specifically, we use position data sent by vehicles for [ui!] TRAFFIC, so-called Floating Car Data (FCD). This data describes the movement of vehicles on the road network.

Since mid-2018, [ui!] has been obtaining floating car data (FCD) from up to 500,000 road users daily via a corresponding data provider as a data stream with a latency of approx. 60-90 seconds and a sampling rate of 3-15 seconds.

Over time, a corpus of over 25 terabytes (as of Dec 2023) has been created here, which is available for analytical questions related to traffic.

Functionality

  • Traffic volume - temporal and spatial distribution of traffic in the road network of the catchment area

  • Lost time - time that a vehicle takes longer due to traffic jams or high traffic volumes than if travelling unhindered

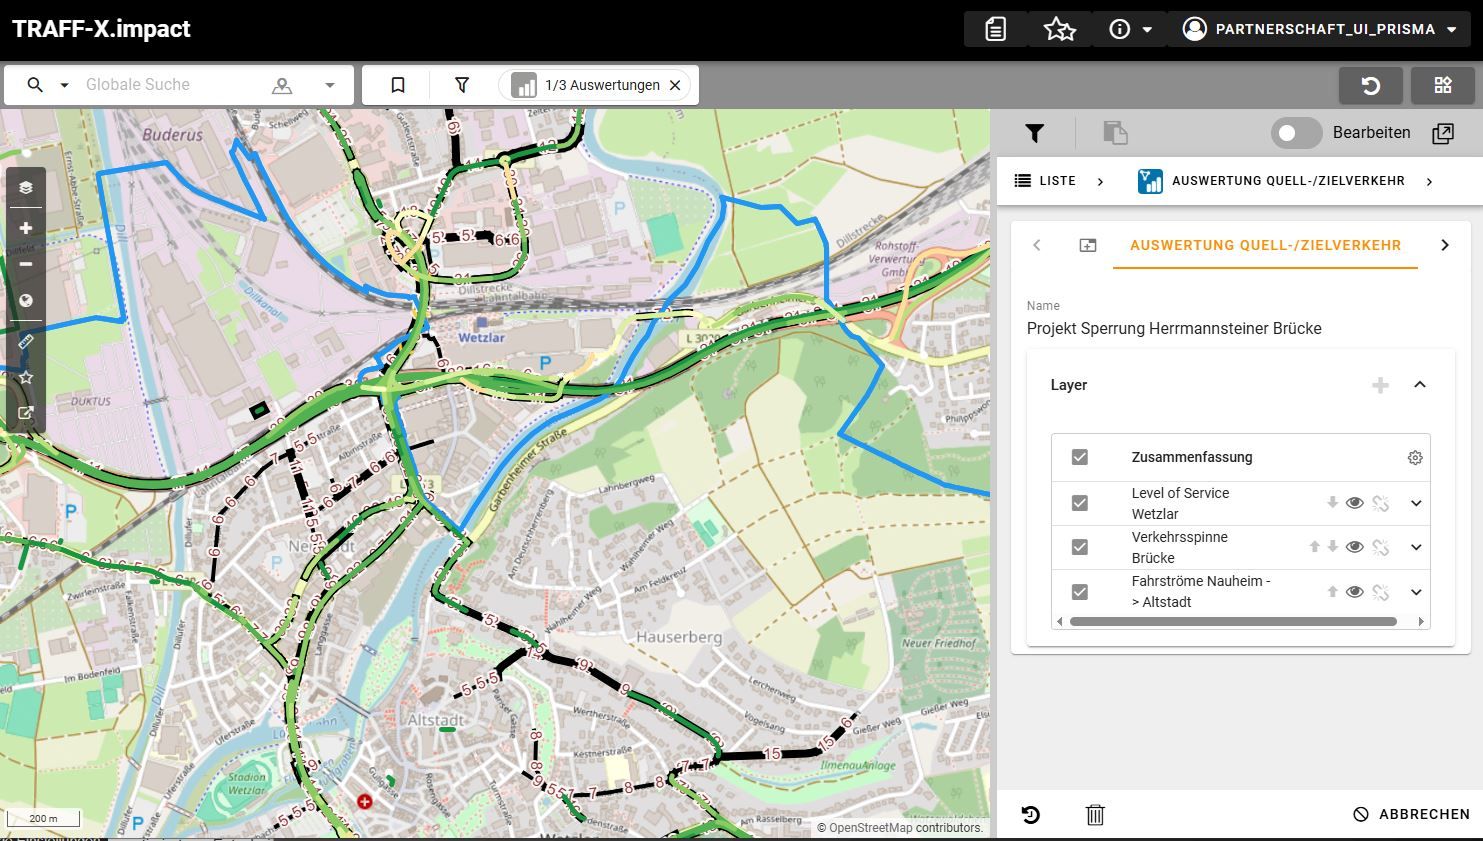
  • Traffic spider - Graphical representation of all traffic flows passing a certain road cross-section, e.g. in situations where restrictions are planned on an important section of road (e.g. bridge closure)

  • Source-destination matrix - description in the form of a matrix of (traffic) demand between the cells or zones of an area; important basis for traffic models that estimate the traffic generated in a road network (apportionment)

Who is [ui!] TRAFFIC aimed at?

Would you like to focus on your professional work?

As a user, you benefit from our Software-as-a-Service offering, which allows you to concentrate fully on your digitalisation projects. Your data is securely collected, stored, processed and visualised as part of our professional service.

We recognise the limited personnel resources of small and medium-sized municipalities and have therefore developed [ui!] TRAFFIC so that you can concentrate fully on your specialist tasks.

Would you like to make data-based decisions?

With the help of our function modules, you can record where congestion regularly occurs in your road network on the basis of data and thus initiate focussed further action against it - either when carrying out further traffic planning investigations or directly when deriving specific measures in the area of network design or traffic management.

Would you like to carry out traffic measures using analyses?

A concrete added value compared to traditional methods of transport planning is the ability of our solution to determine the demand for the typical time periods of a day, for example the morning peak or the evening peak.

Do you want to break down administrative and data silos?

The digitalisation of the public sector generates urban data as part of digital applications and municipal infrastructures using digital measurement and control devices. This data is often stored in silos of municipal infrastructures and is used in a specialised and isolated manner. By using an open urban data platform in accordance with DIN SPEC 91357, this data can be securely brought together in a central location, thereby promoting cross-departmental collaboration.

Are you looking for digital added value for professionals AND citizens?

With [ui!] TRAFFIC, you get results processing with various visualisation options. The [ui!] COCKPIT prepares data for citizens in public smart city cockpits. The [ui!] DATALAB visualises subject-specific data for the specialist user (e.g. climate manager, digitalisation department, and many more).

The building blocks of [ui!] TRAFFIC

Data visualisation

Traffic volume

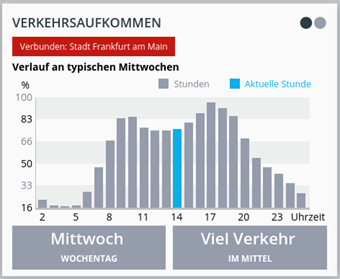
The traffic volume function module gives you an initial overview of the traffic situation on your road network over the course of the week and the day. Specifically, information on the temporal and spatial distribution of the traffic volume is visualised for the catchment area.

The result is a visual overall picture of the traffic situation for all sections of the road network. You can see the change in traffic volume over the course of the working day or at the weekend and recognise patterns that are otherwise only available anecdotally from observations.

This function block allows you to...

  • to obtain a general picture of the motor vehicle traffic situation in your catchment area.

  • To provide your citizens with a basis for decision-making when choosing appropriate journey times.

  • to create a data basis for concrete measures for the efficient design of the road network.

The traffic volume function module provides the basis for an overall understanding of motor vehicle traffic and is therefore suitable as an initial evaluation for all questions. The traffic volume can be displayed in the two visualisation options [ui!] COCKPIT and [ui!] DATALAB.


Added value in municipal use

Added value in municipal use

The data-based analysis of traffic volumes provides significant added value for both the administration and the citizens of your municipality.

  • The provision of information on typical traffic volumes over the course of the day in the [ui!] COCKPIT can help citizens to choose favourable travel times.

  • Analyses of traffic volumes using [ui!] DATALAB can in many cases be used directly as a decision-making aid for traffic management measures and thus contribute to a reduction in traffic jams, environmental pollution and accidents.

  • However, the analyses also support the preparation of traffic planning studies by focussing the study area and the technical issues, thereby reducing planning costs.

In combination with the other function modules, the traffic volume offers numerous additional insights and planning bases for the traffic in your municipality. Depending on the specific traffic challenges, this is followed (in the case of individual evaluations) by analyses of loss times, the use of spider calculations or source-destination calculations.

Specifically, in conjunction with the function module loss times shown below, it is possible to recognise where overloads regularly occur. In this way, problem areas and times in the road network are objectively visible on the basis of the analyses and enable focused further action - either in the implementation of traffic planning studies or directly in the derivation of specific measures in the area of network design or traffic management.

In the case of a recording as a tile in the [ui!] COCKPIT, the combination with the function block loss times or source-destination matrix is appropriate.

Selection [ui!] DATALAB

Selection [ui!] DATALAB

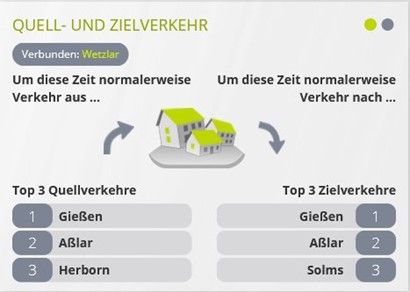
The source-target analysis is displayed in the [ui!] DATALAB in the desktop of the function block. Various filter and configuration options are provided to optimise the display.

  • For example, a satellite image can be activated for the background map; various map layers allow specific customisation of the map.

  • The colouring of the value scale can be adjusted. The time slices can be animated via a playback mode.

  • You can switch between a two- and three-dimensional display, zoom in and out as required and adjust the perspective.
Technical description

Technical description

Like the other three function modules described here, the source-destination matrix function module uses FCD data to obtain the information. In the case of the matrix calculation, the location and time for the start and end of the movement data are analysed for each journey, assigned to the corresponding zones and then cumulated in the matrix for the corresponding time slice.

Apart from measuring demand using FCD data, there is no measurement technology that is suitable for directly measuring demand data across the board. As with the previous function modules, customers no longer need to provide their own data for this purpose.

The results of this analysis are also made available to the customer in [ui!] DATALAB as an interactive map ("Kepler visualisation") or as a CSV export or GeoPackage (for one-off analyses). The Kepler analyses are easily accessed via a modern web browser without the customer having to fulfil any additional technical requirements.

If the Kepler visualisations are used as described here within the [ui!] DATALAB of a [ui!UrbanPulse instance as described here, the analyses shown are updated weekly to show the previous 15 weeks.

Data visualisation

Loss times

Delays occur where the demand for transport exceeds the capacity of the infrastructure (and thus the "supply").

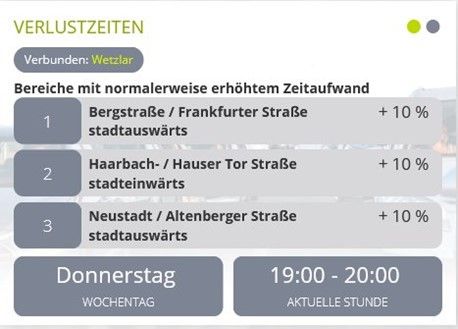
This can be temporary and occur at different points in the network depending on the time of day. The lost time function module gives you an overview of where and when this occurs in your road network. Specifically, speeds are analysed for each individual road section in order to determine where these traffic peaks occur, to what extent and at what typical times.

This function block enables:

  • Create cost-effective initial assessments of overloaded sections of your road network. This allows you to commission costly expertises in a more targeted manner. At the same time, the analyses provide objective indicators for a target-oriented alignment of traffic planning studies and allow the definition of cheaper and higher-quality studies.

  • The detection of evasive traffic in your city, the monitoring of through traffic in residential areas, the assessment of the impact of major events on overall traffic and other traffic-related issues.

Added value in municipal use

Added value in municipal use

The analyses of the loss times function module provide initial answers to a wide range of typical traffic-related questions in municipalities:

  • Where is the river affected by traffic jams or roadworks? At what times?
  • Is traffic diverting from the motorway into the city?
  • Is there through traffic in the residential area?
  • How does traffic from major events affect overall traffic?
  • Where does the targeted installation of counting points for traffic control make sense (and save costs)?

These questions can often only be answered by complex measurements and traffic studies, which - in order not to overlook anything - are often defined more comprehensively than necessary. However, many questions do not require precise answers. Experience has shown that simple, almost qualitative but well-visualised analysis results are often sufficient to make the right decisions about measures.

The contribution of the function blocks and in particular the loss time analyses with its visualisations therefore lies in its ability to determine important facts within a short time without complex measurements, thereby saving time and considerable costs in many cases.

  • Typical application examples are the analysis of traffic quality at traffic lights, on important entry or exit roads, the impact of high traffic volumes in residential areas or also impairments to local public transport on line sections where vehicles share the routes with motorised private transport.

  • Analysing the loss times provides the first objective indications of where the most severe impairments occur, at what times this typically happens and - in particularly pronounced cases - how a regular disturbance propagates upstream in the grid.

  • Here, initial visual presentations of the analyses can often already provide orientation as to where the focus of measures should be placed - without the need for time-consuming, months-long studies, but also without having to rely on subjective anecdotal observations.

Our tip for more insights - traffic analysis in a double pack:

The interactive visualisations of the traffic volume and lost time function blocks represent a powerful combination for the first overall assessment of the traffic situation on a road network. In many cases, they already serve as a basis for decisions on new traffic management measures.

As the lost time function module is always useful when traffic jams, congestion or frequent disruptions present a challenge on the current road network, it is ideally complemented by the information from the holistic analysis of the traffic volume.

Selection [ui!] DATALAB

Selection [ui!] DATALAB

In [ui!] DATALAB, the results of this analysis are made available to the customer as an interactive map ("Kepler visualisation") or as a CSV export or GeoPackage (for one-off analyses). The Kepler analyses can be easily accessed via a modern web browser without the customer having to fulfil any additional technical requirements.

[ui!] DATALAB-Kachel (Kepler): Verlustzeit

Visualisierung des Verkehrsaufkommens für kommunalinterne Zwecke im [ui!] DATALAB mittels einer Kepler-basierten Web-Anwendung und Filtermöglichkeiten für unterschiedliche Zeiträume.

Technical description

Technical description

The calculations of the function module loss times are also based on the analysis of FCD data. By analysing the speeds and their progression over the day and week, we can determine the impairment of traffic quality and then display it clearly on a map. As with the first function module, there is no need for the customer to provide data for this.

For internal municipal use, the results of this analysis are made available to the customer in [ui!] DATALAB as an interactive map ("Kepler visualisation") or as a CSV export or GeoPackage (for one-off analyses). Kepler visualisation is a web-based service (open source software library) for the interactive display of geo-related data.

Access is very easy via a modern web browser, without the customer having to fulfil any additional technical requirements. Various filter and configuration options are provided to optimise the display.

  • For example, a satellite image can be activated for the background map; various map layers allow specific customisation of the map.

  • The colouring of the value scale can be adjusted. The time slices can be animated via a playback mode.

  • You can switch between a two- and three-dimensional display, zoom in and out as required and adjust the perspective.

If the Kepler visualisations are used within the [ui!] DATALAB of an [ui!] UrbanPulse instance as described here, the displayed evaluations are updated weekly to show the previous 15 weeks.

Traffic spider

The traffic spider function module can be used to analyse a highly congested section of the road network in order to initiate targeted countermeasures. The heavily loaded section is often a bridge or a road section for which construction work is pending.

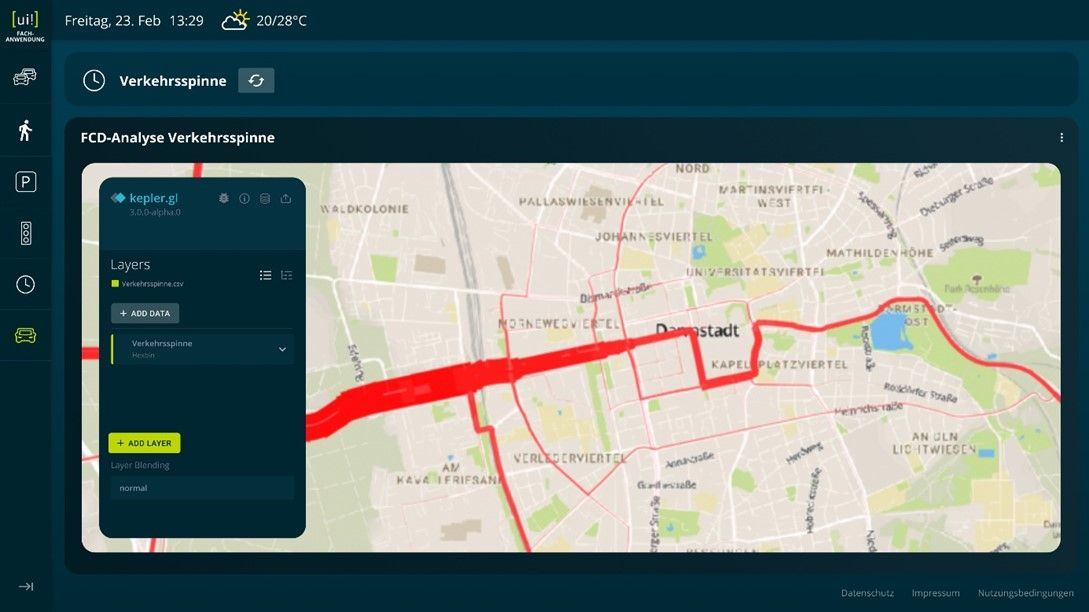
Specifically, the traffic spider provides an analysis and intuitive visualisation of the traffic flows that pass through a predefined section of road, the so-called reference cross-section.

This function block enables:

  • a clear visualisation of the directions from which vehicles are approaching a particular section and the routes they are taking to continue their journey.

  • A differentiated view by working day / weekend and time of day in order to achieve a comprehensive analysis of traffic behaviour

This analysis is called a "spider" because all currents are bundled in the centre, i.e. on the reference cross-section, and the visualisation on the grid resembles a spider with its body and legs.


Added value in municipal use

Added value in municipal use

The analyses of the traffic spider function block are particularly suitable for situations in which measures are planned on a section of road that is important for traffic and reduces its capacity. They therefore provide initial answers to a wide range of typical questions in municipal transport.

  • Which traffic flows are affected by the closure of a bridge, which often involves long detours, or by congestion on a (reference) route?

  • Where is the best place to set up dynamic or static signs to inform or divert these road users?

  • Where does the through traffic on a city centre route come from and where does it go, e.g. in the event of lane closures?

These questions can be answered much more efficiently with an FCD analysis than with time-consuming surveys or expensive licence plate-based traffic surveys. Our database also offers the possibility of analysing large periods of time or making comparisons between different time periods.

The analysis makes it possible to determine the most important traffic relationships that are affected by such a planned measure. This includes statements about the traffic volumes on the reference section, but also in the inflows and outflows. This already makes it possible to identify the most important locations for information signs or diversion recommendations.

Selection [ui!] DATALAB

Selection [ui!] DATALAB

Only visualisation in [ui!] DATALAB is possible for the traffic spider function module, as it involves specific analyses of individual, critical route sections for the specialist user.

[ui!] DATALAB-Kachel (Kepler): Verkehrsspinne

Technical description

Technical description

Like the other three function modules described here, the traffic spider function module uses FCD data to obtain information. They use the information contained therein about the routes taken by each recorded road user and analyse them accordingly. It is important to mention that the FCD data used for this is the ideal data basis for such an analysis. The advantages of FCD data at a glance are

  • Traditional traffic planning methods, such as comprehensive surveys or video cameras with licence plate recognition, do not provide anywhere near the density and quality of information as the traffic spider analysis available here as a functional module.

  • This already results in cost savings and, at the same time, an improvement in quality during site preparation and (in the case of dynamic signs) site operation.

  • This also ensures that the greatest possible traffic benefits can be realised because there is certainty that the right traffic connections, signs and other information channels are being addressed.

The differentiation of the analyses according to different times of day even enables the derivation of different information and diversion recommendations depending on the time of day, where this is particularly important due to high capacity utilisation.

As with the previous function modules, there is no need for the customer to provide their own data for this purpose. The results of this analysis are made available to the customer in [ui!] DATALAB as an interactive map ("Kepler visualisation") or as a CSV export or GeoPackage (for one-off analyses). The [ui!] DATALAB is your tool for advanced traffic data analyses that integrates seamlessly into your [ui!] UrbanPulse and provides you with a municipal situation picture.

Access is very easy via a modern web browser, without the customer having to fulfil any additional technical requirements. A display via tiles or map in the [ui!] COCKPIT is not yet provided for the traffic spider function module. The analysis of a traffic spider is displayed in [ui!] DATALAB in the desktop of the function module. Various filter and configuration options are provided to optimise the display.

  • For example, a satellite image can be activated for the background map; various map layers allow specific customisation of the map.

  • The colouring of the value scale can be adjusted. The time slices can be animated via a playback mode.

  • You can switch between a two- and three-dimensional display, zoom in and out as required and adjust the perspective.

  • The visualisation allows each of the two driving directions to be activated or deactivated separately via the reference section in order to adapt the display to the inspection.

If the Kepler visualisations are used within the [ui!] DATALAB of an [ui!] UrbanPulse instance as described here, the displayed evaluations are updated weekly to show the previous 15 weeks.

Data visualisation

Source-target matrix

The source-destination matrix function block divides the road network into cells and analyses how much traffic flows in individual cells and between the cells.

Specifically, transport demand is determined for this purpose. For transport planners, the concept of transport demand describes the need for mobility, and the "realisation" of demand then leads to the actual volume of traffic, with all the negative consequences. Until now, transport planners have only been able to determine such demand data and models using complex socio-demographic methods, which often take months to develop and incur considerable costs.

This function block enables...

  • the acquisition of many fundamental insights into transport demand in a very short time and - compared to transport planning models - at a manageable cost.

  • estimate the proportion of demand that leads to motorised traffic volumes using floating car data (FCD). As in transport planning models, spatial zones or areas are defined here; the analysis then provides an indication of how much traffic flows between or within the cells based on the available journeys.

This also gives rise to the name "source-destination matrix" for this function module: the zones are "sources" and "destinations", and the traffic volume between them can be represented as a matrix.


Added value in municipal use

Added value in municipal use

The source-destination matrix function module provides you with a basic overview of transport demand, which is the determining factor for the volume of traffic in a municipality. If you know where some of the vehicles in a municipality come from, where they leave the municipality, or even what proportion of the vehicles only move within the municipality, you can tackle traffic management challenges in a much more appropriate and targeted manner.

This allows you to easily create basic contributions to the assessment of traffic situations within a very short time, for example by answering these and similar questions:

  • Where do the tourists who park in the car parks in our recreational areas at the weekend come from?
  • For which groups of travellers can digital visitor guidance measures be set up on suitable sections of the route?

  • What proportion of traffic in the city centre only has short journeys and could possibly switch to other modes of transport?

  • How high is the commuter share of traffic in the city centre? Where do the main commuter flows come from?

Creating a common, data-based basis of information regarding the need for mobility should therefore always be one of the first steps when specialist departments or politicians are looking for solutions in the field of road transport, as this makes all subsequent decision-making processes much simpler and more consensus-based.

A concrete added value compared to the classic source-destination matrices of transport planning is the ability of the function module to determine the demand for the typical time periods of a day, for example the morning peak or the evening peak. As demand models are usually calculated for 24 hours in total, this information is not available there due to the principle.

But even if initial analyses using the source-destination analysis function module are followed by a transport planning study based on a complex demand model, this can be commissioned in a much more qualified manner and thus lead to the desired results more cheaply and quickly. The functional module therefore has the potential to qualitatively improve the results of planning and decision-making processes in the road transport sector - at unbeatably low costs and in the shortest possible time.

Report from the field:

We have now used these analyses to advise a large number of tourist regions and are currently supporting local authorities in analysing vehicle traffic in shopping streets or residential areas.

The source-destination analyses can often be ideally supplemented with analyses from Smart Parking, namely via the parking distribution and parking search traffic function modules (see Smart Parking solution sheet).

Selection [ui!] DATALAB

Selection [ui!] DATALAB

The specialised application is provided in the form of a web-based interactive map. The results of the data analysis on parking search traffic are displayed geo-localised on the map. The interactive map allows users to customise the presentation of the data by setting filters.

Technical description

Technical description

Parking search traffic is determined on the basis of floating car data (vehicle movements measured by navigation devices and / or mobile devices) and is made available for motorised private transport. A detailed description of the data fields included can be found below.

The evaluation looks at the period of the last 15 weeks before the order. Spatial cells are differentiated with an edge length depending on the size of the area under consideration (100m-10km), as well as a distinction between weekday / weekend and four different traffic-relevant day phases as time slices.

In a first step, the actual parking processes are analysed using a machine learning model. The previous telemetry points of parked vehicles in a 300 metre area are then aggregated into the individual cells and time slices.

The following data fields are provided as results of the analysis:

  • lat / lon: The latitude and longitude of the centre of a spatial cell in the EPSG:4326 (GPS / WGS84) coordinate system.

  • parking_search_pct: The percentage of vehicles in a spatial cell that are looking for a parking space.

  • relative_parking: A measure of the relative parking volume in the spatial cell as a whole. Standardised for the duration of the time slice in order to establish comparability between time slices.

No further data sources are required for this function block, i.e. no connection of connectors. Floating Car Data (FCD), which is used by [ui!] to carry out the analyses, is used as the data source.

Would you like to find out more about our solutions?

We are also happy to assist you at our branches in Berlin, Darmstadt, München, Walldorf oder Chemnitz are available for a demonstration or will visit you on request.